See your retirement play out 10,000 ways.
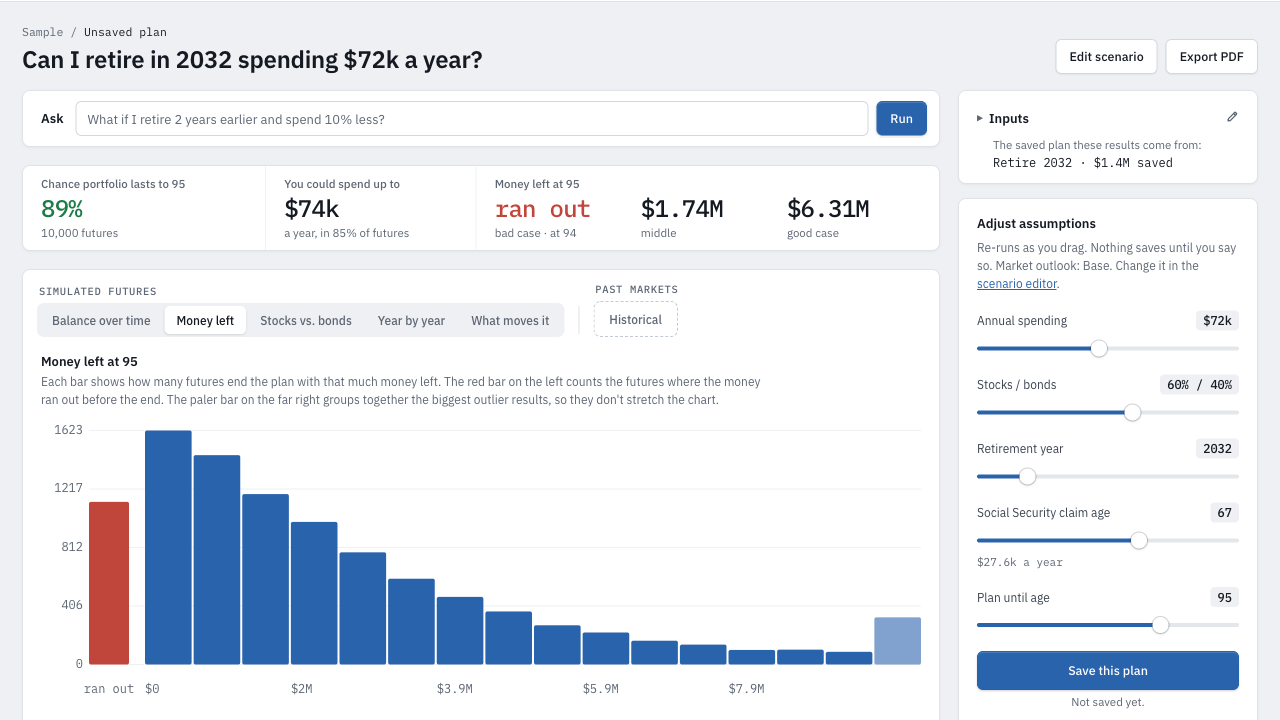
How long your money lasts, how much you can spend and how much risk is right, in plain words and clear charts. Change a number and watch it all update.
Ran your plan with one change: retiring in 2034.
Retiring in 2034, the money lasts to 95 in 95% of futures, up from 89%. You could spend up to $80k a year, up from $74k.
What's different
Clear answers
Every chart explained
How long your money lasts, how much you can spend and how much risk suits you, each in a sentence before any chart. Every amount is in today's dollars.
How much you could spend
The most you could spend each year and still have your money last in 85 of every 100 futures.
What makes the most difference
See which change helps most: working a year longer, spending $5,000 less, or a different mix of stocks and bonds.
What goes in, and how it's run
Four totals for your savings
Your savings go in as four totals (cash, taxable, tax-deferred, tax-free), not account by account. Nothing to link, nothing to upload.
10,000 futures, run again as you drag
Drag a slider and the futures run again as you go (a Monte Carlo simulation), so trying an idea costs nothing.
Replayed through history
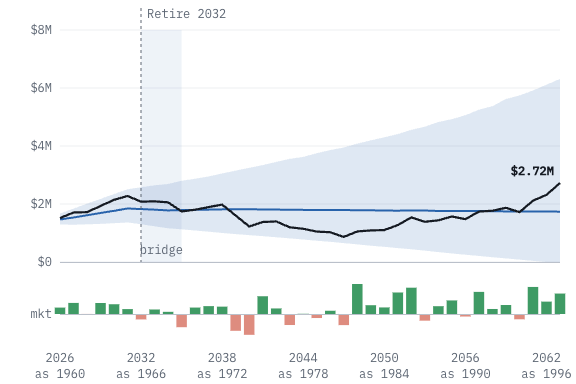
See how your plan would have done retiring in 1929, 1966, 1973 or 1982, or any year you pick.
Check it before you trust it
Try it before you sign up
The sample plan opens with full results. No account, no email, and nobody will call you.
The whole range, year by year
See the spread from the worst futures to the best, then open a typical, unlucky or lucky one and follow it year by year. The planner lists what the model leaves out.
Send someone a copy
Send a link to your partner, a friend or your advisor. They get their own copy to change, and yours stays as it is.
Try it now with a sample plan.
Change anything and experiment. Nothing is saved until you create an account and save it.